
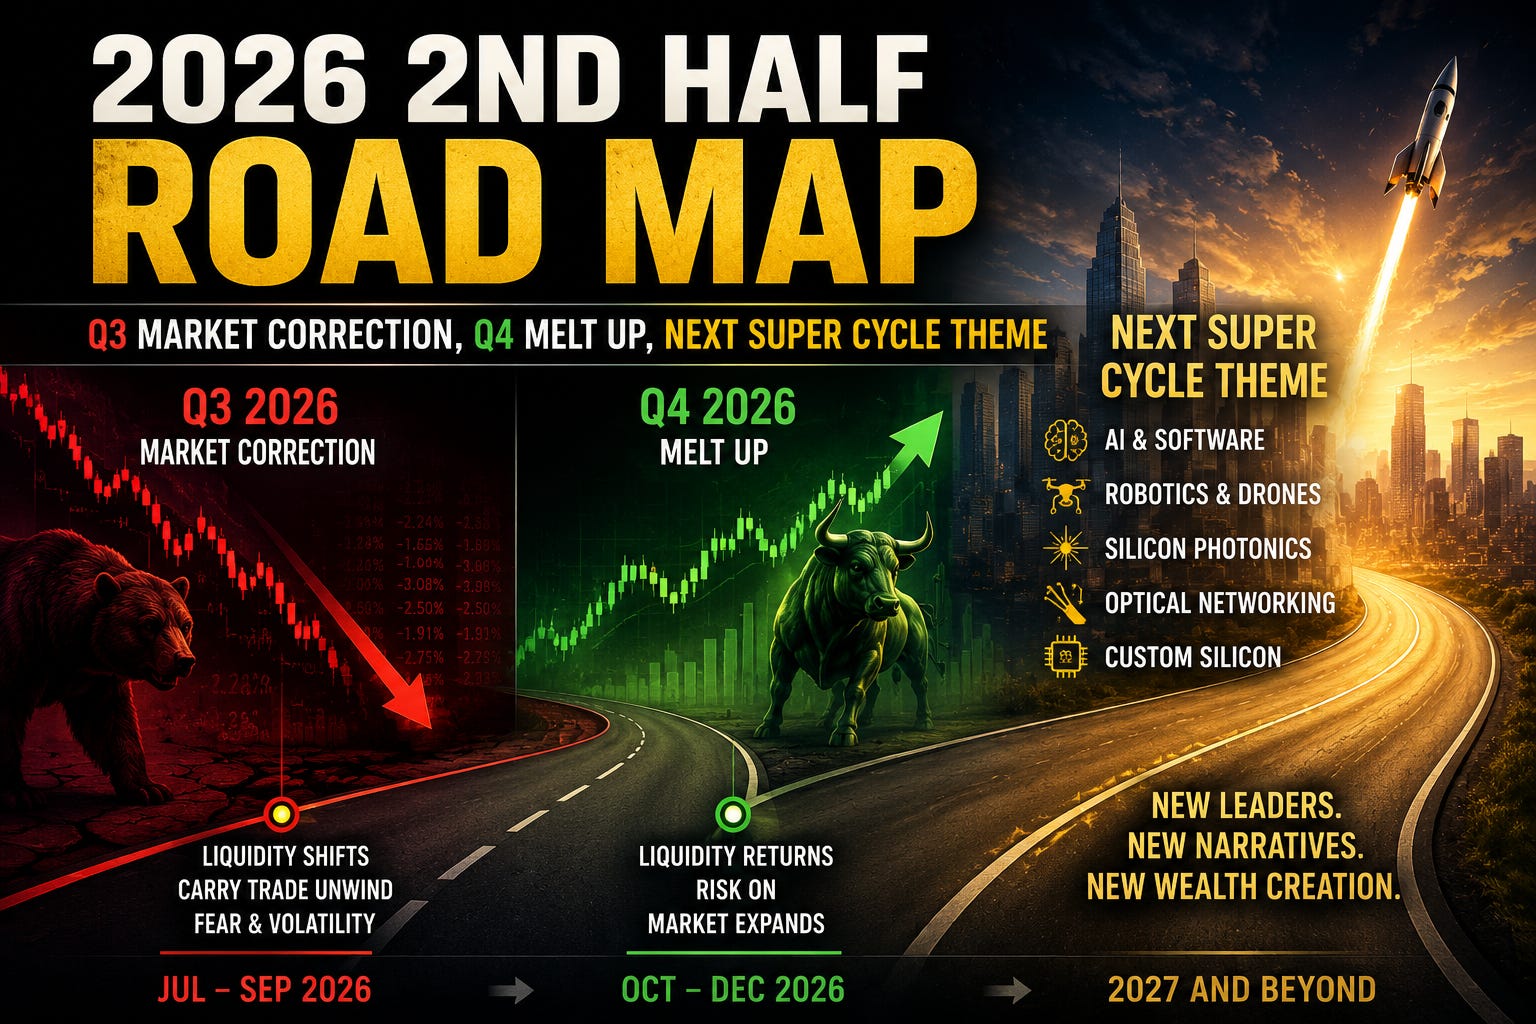
If you’ve read my last four articles and the notes I’ve posted over the past two months, you already have a good idea of what is coming and what I am going to discuss in this article. I will, however, try to be more precise. None of my articles or notes are behind a paywall, so anyone can read them. Only the subscriber chat is paywalled, where I share my entries, exits, and day-to-day views and opinions.
We are going to quickly go through those articles to get up to speed on 2026. If you haven’t read them yet, I recommend doing so first, as they provide important context for what follows. If you already read all of them, scroll down to July Opex is over What now section and the anatomy of Q3 correction section.
Dec. 19 article looking ahead to 2026:

Almost everything discussed in this article has played out like a crystal ball throughout 2026 so far, at very least go read the conclusion of that article. This article has remained relevant throughout all of 2026 and I believe it will continue to be relevant during the second half of the year.
Dec. 30 article looking further into 2026 and beyond:
This article will become especially relevant toward the end of Q3 or sometime in Q4, when fear reaches its peak and the echo chambers try to convince everyone that the bubble is bursting.
April 4 Iran war trade:
This article could leave readers with the impression that I lost money during the second quarter, but Q2 was actually my most profitable quarter since launching my Substack. To understand what happened, read this follow-up article from May 31:
It explains exactly how we achieved those historic results in Q2. In the market update section of that article, I also gave a very exact projection of when the semiconductor sector would top under the market update section. Below is an excerpt. We wrote that article while we were still holding some of our long semiconductor positions that had not yet been closed. These two articles are also an important lesson in why you should never get married to a market view and should always be willing to adapt when conditions change. They will also become relevant again after the Q3 correction bottoms because many of the non-oil and gas trades discussed in the April 4th articles should perform well during the next melt-up that I expect to begin in Q4. More on that when we get into the second-half outlook further below.
The Crystal Ball June 7 note:
This note was posted on June 7. Read it carefully, then study the SPX price action day by day through until July 17. Keep in mind that the monthly SPX options expire in the morning when the market opens on Opex day. However, the last day to trade those options is the day before, on July 16.
June 27 note:
After telling readers roughly a month in advance when the semiconductor sector would top, I signaled in this note that the week’s closing candle was the confirmation. At the same time, I called for a rally into the July 4 weekend to retest the all-time highs. I also repeatedly said on X that every rally in semiconductors should be viewed as a selling opportunity at that point. During the first two trading days after I posted that note, SMH rallied sharply, tagged the lower end of the June 22 all-time high candle, and failed.
I am not sharing all of this to take a victory lap. I am not one of those people who draw lines on both sides of a chart, present every possible outcome, and later take a victory lap showing the one that hit. I am sharing it because my views have been consistent and straightforward, and they have been publicly available without a paywall since the day they were published. Together, they show the timeline of my thinking, including the mistake I made at the end of March and how I corrected it. That period was especially challenging because of the constant “war on, war off” drama. As someone who closely watches option flow, I was able to see where the line in the sand had shifted and adapt accordingly. My 12 months anniversary on substack just completed. If you are curious how my trades did using these frame work, you can read my annual report here:
Okay now that we are caught up and July Opex is over, lets get on with this Q3 correction.
July Opex is Finally over, what now?
I received quite a few DMs from my free subscribers and X followers asking whether I had shorted the market or started buying puts. This was because I had been saying on X that I wouldn't turn bearish until July Opex and that I would likely start buying downside bets on July Opex or during the following week if the market moved higher. The answer is no. I have not yet shorted the market or bought a single downside position. The only thing I did in preparation was close out the last of my long positions. I would have bought puts on Friday if market went above Thursday’s levels but it opened gapped down and went red. My options-only portfolio is now essentially 100% cash. My mixed portfolio is also almost entirely in cash, with the exception of three micro-cap helium names that I am slowly accumulating and my dip buying in SpaceX, which I bought on the dip after warning people not to buy during the $220+ IPO frenzy.

SPCX is currently at an attractive entry price. It doesn't matter whether the stock goes up or down because it is the type of stock that can eventually be owned at a cost basis of zero if you sell option premium at the right times. It's the new Elon-related stock with strong meme appeal and high option premiums. Just make sure you buy shares in multiples of 100 so you can write covered calls against your entire position. I don't plan on selling my shares. Instead, I plan to strategically reduce my cost basis to zero by consistently selling option premium on them. I think it can go lower during q3 correction but in the next rally before August Opex, I will sell calls. Don't attempt this strategy unless you are well versed in options.
That is it in terms of Positions. Rest is all cash. The two new portfolios that is getting launched this week fully funded from the profits from options only portfolio is ready and is also sitting in cash. Will discuss that further below after we dissect the market.
Anatomy of the Q3 Correction
Before I get into my outlook, I want you to study the SMH, QQQ, and SPY charts starting two weeks before and extending three months after the following dates: July 31, 2024, January 20, 2025, December 19, 2025, and June 16, 2026. Obviously, you can’t study three months after June 16, 2026 because we are only about one month past that date, but I am going to explain what I believe is likely to happen. If you read my December 19 article, you already know why these dates matter. They mark the four Bank of Japan rate hikes of 15 basis points, 25 basis points, 25 basis points, and 25 basis points. What you are seeing on those charts during the periods that follow is, in my opinion, the price action driven by the unwind and repricing of the yen carry trade.
During each of those periods, the financial media and social media conditioned investors to believe that every move was caused by whatever headline happened to dominate the news cycle. One month it was DeepSeek, another month it was China’s chip restrictions, then Lil Kimi, tariffs, or the constant “war on, war off” headlines. Those stories can certainly influence short-term sentiment, but they are usually not the primary driver. Instead of focusing on the headline of the day, pay attention to what the Bank of Japan, Japan’s Ministry of Finance, the Federal Reserve, and the U.S. Treasury are doing. Out of those four, I believe the Fed and especially the U.S. Treasury deserve the most attention because liquidity ultimately drives where money flows.
When financial conditions tighten after a BOJ rate hike, the U.S. Treasury can offset part of that tightening by injecting liquidity into the financial system through movements in the Treasury General Account. As Treasury spends cash and the TGA declines, liquidity flows into banks and the private sector, helping stabilize markets. Eventually, money rotates into new leadership, and once that process is complete, markets can enter another melt-up phase.
After the June 16 BOJ rate hike, the Treasury responded with the largest liquidity injection of the four episodes, drawing down roughly $207 billion from the TGA. That was significantly larger than the responses following the previous BOJ hikes and, in my opinion, one of the reasons the market remained far more resilient than many expected. Last week, however, Treasury reversed part of that support by rebuilding the TGA and removing roughly $74 billion of liquidity. The market reacted negatively, but most investors were told the weakness was caused by Lil Kimi. Whether that headline contributed or not is beside the point. The liquidity backdrop had already become less supportive.
So far, USD/JPY has remained around the 162.5 area without a meaningful move lower. That makes the next BOJ and FOMC meetings especially important. The BOJ is widely expected to continue its gradual normalization path, so it is unlikely to surprise markets with aggressive action. At most, it can influence expectations through a more hawkish tone. The Ministry of Finance, however, has tools that can have a much more immediate impact. It can directly intervene in the foreign exchange market by selling part of Japan’s large U.S. dollar reserves to buy yen, strengthening the currency and increasing pressure on carry trades.
Leading into the next FOMC meeting, I will be monitoring the Treasury General Account every day to see whether Treasury continues rebuilding it or resumes injecting liquidity. I will also be paying close attention to comments and actions from Japan’s Ministry of Finance toward the end of the month. The two most important Treasury dates to put on your calendar are August 3, when Treasury releases its updated borrowing estimates for the current and next quarter, and August 5, when it announces the Quarterly Refunding, including how much it plans to borrow and how it intends to finance those needs. Those announcements should provide a much clearer picture of the liquidity outlook and, in my opinion, will go a long way toward determining when the Q3 correction bottoms and when the next melt-up begins.
Earlier I said that headlines are mostly noise, and I still believe that. However, not every headline should be ignored. Tariff announcements, military conflicts, and geopolitical events can absolutely move markets because they directly affect capital flows and investor behavior. They often amplify moves that are already underway because of liquidity and positioning. During periods of geopolitical escalation, demand for the U.S. dollar typically increases because it is viewed as a safe-haven asset. These events happening around these dates are by design anticipating upcoming moves. Japan’s Ministry of Finance will highly likely intervene in some capacity to support its currency. At the same time, Treasury’s weekly cash management decisions will continue to influence liquidity, and in my view, that remains one of the most important factors driving the market over the coming weeks. I don’t trade Forex but if I did I would take a stab at going long Yen when its above 162.5 anticipating a move to test 150.
I asked you guys to study the charts around the previous yen carry trade dates because it shows how this correction can unfold in different ways. It could be a controlled selloff over several weeks, which I believe has already started in tech and semis. QQQ has been struggling while SPY is on the upper side because of sector rotation, exactly as I mapped out in the june 7th note. Eventually, I expect all major indices to at least test their 200-day moving averages before October Opex. Whether that happens in waves or through a sharper move lower will depend heavily on how the U.S. Treasury manages liquidity. 200 day is at minimum and being conservative for this correction bottom. Break down below 200 day average and vix over 35 is also possible.
If you are bearish, the better strategy is to fade rallies instead of chasing the market lower when fear is already elevated. This was the reason I didn’t make any downside bets on Friday as originally planned. I would actually welcome another rally in semis on some random AI headline because I think it would create another great fade opportunity. The AI crowd will continue pushing bullish narratives while institutions rotate out of the old leaders and into the next cycle winners.
When this correction bottoms, the market will shift toward new narratives. I think many investors will rush back into semis to buy the dip, but I do not expect SMH to lead the next melt-up. My base case is that SMH does not make a meaningful new high until late 2027 or sometime in 2028 as many of the current AI winners consolidate. The next leadership could come from areas that were overlooked during the previous cycle.
I am not looking to build long-term positions until I see how Q3 correction develops. I would be very cautious until October 20 market close before deciding to go long shopping for long term portfolios. The biggest dates I am watching are August 3 and August 5 because Treasury’s borrowing estimates and Quarterly Refunding should give us a clearer picture of future liquidity. If we get peak fear around those dates while the market is testing major support, that could mark an important turning which could induce a rally but based on current order flow SPX needs to below 8000 until Dec Opex. For this reason if the market already broke below 200dm by aug 5 and rallies, that may not be the melt up. It will likely consolidate and re-test the bottom. Don’t look for any catalysts or narratives they will fall in place magically and if it doesn’t exist it will be manufactured. Instead pay attention to the treasury and the order flow.
Long term, I remain very bullish. I still expect SPX to reach around 8,700 by the end of October 2027, as discussed in my December 30 article. For the next super cycle, I am watching some SaaS, drones, robotics, silicon photonics, optical networking, and custom silicon. Some of the SaaS names from Michael Burry will become attractive after the correction and I recommend subscribing to him if you want to read his thesis. Yes he was early but it will play out. I shared my view of Michael burry in this note the other week.
I mentioned Burry because he already bought some of the names on my watch list but he is early. ADBE which he bought early is among my potential top buys at the bottom of the correction. In fact, we bought adobe at the low recently for 193.x along with call options in our swing trading portfolio in June and sold in the mid 220’s. When this correction bottoms, I will be adding Adobe.
My bold prediction is that MRVL becomes the MU of the next cycle. and breaks above 1000 with in 16 months from the correction bottom. When the long-term buying window opens, names like AVGO, ADBE, NOW, MSFT, MRVL, META, and AMZN will be on my watchlist, but the biggest returns usually come from finding the next picks-and-shovels companies before they become obvious. The trades discussed in the Iran War trade article from April should play out as well. We will discuss all this in the subscriber chat when the time comes. There is a chat thread for each portfolio. There is also something that is currently open to everyone and that is 25k to 100k challenge portfolio. This was originally part of the Founding Tier because it was funded 100% from the profits of the options-only portfolio. However, after repeated requests from other members, it is currently open to everyone for now. All my articles and notes are are free for everyone to read. If you like what you read, please restack and share wherever you can.

We will discuss this in the chat when the time comes. Now the aim is to finish all portfolios in the green for q3 while the market and everyone else's portfolios goes red.
why will MRVL be the next MU ??