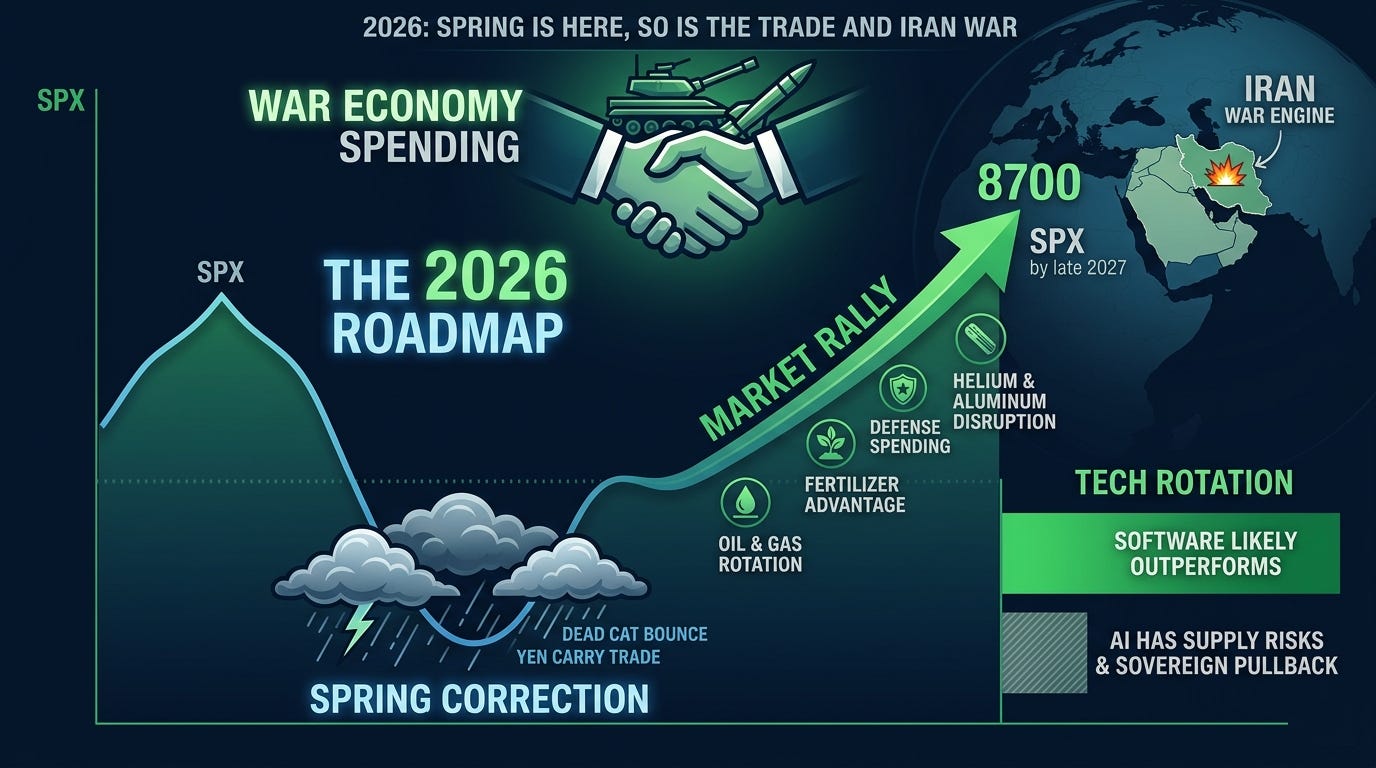
2026: Spring Is here, So is the Trade and Iran War
Market Bottom. Market Rally. Rise of Software.

The two pre-requisite to this article are 1. 2026 a year for Swing Traders: Yen Carry Trade, Market Correction, New Fed Chair, Midterms published Dec 19, 2025 and 2. Shiller P/E, Case for buying 2026 correction & 8700 SPX published Dec 30, 2025.
Four months ago, I published two pieces that laid out everything you needed to know about 2026 before the year even started. The first argued this would be a year defined by swing traders, not buy-and-hold investors. The second made the case for a correction, a bounce, and ultimately SPX at 8700 by late 2027. Both pieces are worth going back to read if you have not already, because everything that is happening right now was outlined there. After you read those, continue below for more roadmap.
Contents:
Where we stand today
The Carry Trade Has a New Engine, Iran War
Updating the Roadmap
The Fertilizer Trade
The Shipping Collapse and Insurance
What the Conflict Has Done to Helium and Aluminum
In tech, why Software, Not AI, Is the trade in th Next Rally
How the Next ATH Actually Gets Built: Wary Economy
Don’t become exit liquidity following big accounts
Era of Swing Trading and end of Buy and Hold.
How We Are Positioned
Here is where we stand today.
The double-digit correction I said would happen in Spring already began and the the more violent drop is going to come once the current dead cat bounce that began at the end of q1 ends. And the fuel driving this particular move is considerably more dangerous than the 2025 tariff fuel.
The Carry Trade Has a New Engine, Iran War
Last year, the yen carry trade got its energy from tariff drama. Tariffs create noise, uncertainty, and currency dislocations, but they are ultimately negotiable. What we are dealing with now is not negotiable in the same way.
The Middle East conflict has become the dominant macro force in this market. When you combine a near-shutdown of the Strait of Hormuz with an equity market that was already priced to perfection, you get the conditions for sustained, not fleeting, volatility. This is a structurally different carry trade dynamic than anything we saw last year. The yen carry trade now has a geopolitical engine, and those tend to run hotter and longer than policy-driven ones.
Updating the Roadmap
In December I wrote that the bottom would come sometime around June, followed by a V-shaped recovery that could carry SPX to 8700 by October 2027, with a topping process potentially stretching toward the 2028 election. That base case still holds, but I want to be transparent about the scenarios I am watching.
The Iran conflict introduces a variable that changes the probability distribution of outcomes. What was previously my base case of a June bottom and sharp recovery is now one of several scenarios. Here is how I am thinking about it.
The most likely path remains a meaningful bottom forming sometime in the June to August window, followed by a recovery that accelerates through late 2026 and into 2027. The geopolitical noise eventually gets priced in, capital finds its footing, and we resume the longer-term trend toward new highs.
A secondary scenario is that this correction behaves more like 2022. In that case, the pain creeps into Q3 and Q4 before the recovery begins. The eventual move to all-time highs and 8700 still happens but only after a brief bear market rather than 2025 style quick recoery.
There is also a tail scenario, which I want to mention precisely because I do not want to pretend it does not exist: the market may have already printed a multi-year top. I think this is the least likely outcome, but it is on the table and we should not be blind to it. The good news is that this scenario changes my positioning very little, because we are not trying to predict the exact bottom and ride it up. We are trading individual names.
Why Individual Names Matter More Than Index Calls Right Now
This is the part I want to spend the most time on, because it is where the actual money is being made.
The day the conflict escalated significantly, we sold everything and rotated hard into oil and gas names with zero or minimal Middle East exposure. The logic was simple: when a major supply corridor gets disrupted, domestic and non-affected producers do not just benefit, they tend to move vertically. That is exactly what happened as both our portfolios have gone up vertically since the war began because of the rotation into energy.
I shared many of those names on X after we entered, and the full transaction log, including entry prices and sizes, is with subscribers on my substack subscribers chat.
The same framework applies many other trade ideas that we will discuss below.
The Fertilizer Trade
Roughly a third of global seaborne fertilizer trade moves through the Strait of Hormuz. That corridor has been essentially closed since late February. The Middle East, particularly Iran, Qatar, Saudi Arabia, and Egypt, accounts for nearly half of global urea exports and about 30 percent of global ammonia exports. When that supply gets disrupted, prices move, and companies with no Middle East exposure become structurally advantaged overnight.
The major publicly traded names in this space are well known (example, CF and NTR, both good buy the dip candidates) and I will not list them here since I discuss specific entry points and sizing in the subscribers chat when I make the trade. But the trade structure is identical to what we did in oil and gas: go long on domestic or non-affected producers at the right time, and look at the short side for companies with heavy Middle East concentration. Most of the short candidates are not American-listed, which limits the playbook somewhat, but there are names worth examining carefully if you like shorting but I am ignoring that side of the trade in my portfolio as it focuses exclusively on American listed names only.
Some of the most interesting opportunities here are not the obvious large names. There are smaller, less-followed names where the dislocation is more extreme and the move, when it comes, will be sharper. I have already shared a watch list in the war and taken few positions but will add some more when time comes. Right now portfolio is mainly concentrated on the oil and gas names even though even after taking lot of profit.
The Shipping Collapse and What It Means for Traders
Before we get into the specific commodity disruptions, there is a layer underneath all of it that affects everything moving in and out of the region: the complete breakdown of the maritime insurance market and what it has done to tanker economics globally.
To understand the scale of what happened, you need to know what normal looked like. Before February 28, war risk insurance premiums for vessels transiting the Strait of Hormuz ran between 0.125 and 0.25 percent of a ship’s hull value for a single voyage. For a $100 million tanker, that was roughly $200,000 per trip. Expensive but manageable, and baked into freight rates that the market had accepted for years.
Within 48 hours of the conflict starting, that math ceased to exist. Major insurance consortiums including Gard, Skuld, NorthStandard, the London P&I Club, and the American Club all cancelled war risk coverage simultaneously. The International Group of P&I Clubs, which collectively covers roughly 90 percent of the world’s ocean-going tonnage, issued 72-hour cancellation notices across the board. The war risk market for Hormuz transit did not just get more expensive. It effectively ceased to function. Underwriters were not raising their prices, they were declining to quote at all.
When coverage did begin to trickle back, the numbers were unrecognizable. Premiums for vessels attempting to transit the strait jumped to between 5 and 10 percent of hull value. On that same $100 million tanker, you are now looking at $5 million to $10 million for a single voyage. Lloyd’s of London finance editor David Osler noted that before the conflict, typical Hormuz rates ran between 0.15 and 0.25 percent of hull value for a one-week policy. After the conflict began, quotes reached 5 to 10 percent of hull value. That is a 40-fold increase at the top end in a matter of days.
The freight rate story is just as dramatic. VLCC rates, the day rates for the supertankers that carry roughly 2 million barrels of crude oil per voyage on the Middle East to China benchmark route, hit an all-time record of $423,736 per day early in the crisis. That was a 94 percent increase from the prior Friday’s close and more than six times the five-year average. The average rate for the same route was around $2.50 per barrel last year. Within days of the conflict starting, one Korean firm was asking the equivalent of $20 per barrel. One Greek-owned VLCC leased out at $350,000 per day. Another was chartered by India’s Reliance Industries for $538,000 per day. Hapag-Lloyd, one of the world’s largest container shipping lines, stopped bookings into and out of the upper Gulf entirely, estimating the war was costing the company $40 to $50 million per week.
Even those rates assumed someone would attempt the transit, which most owners refused to do regardless of what the insurance market offered. Tanker transits through the Strait of Hormuz collapsed by approximately 92 percent compared to the week before the conflict. As of early March, 247 vessels of meaningful size representing roughly 6 percent of global tanker deadweight tonnage were stranded inside the Middle East Gulf. Expanding to the broader region, 984 tankers representing approximately 22 percent of the entire global fleet were stuck or displaced. Iran had made 21 confirmed attacks on merchant ships by mid-March, and IRGC commanders were explicitly threatening to set ablaze any vessel attempting to cross.
The alternative routes are not simple fixes. VLCCs are too large to fit through the Suez Canal, which means any Cape of Good Hope diversion adds roughly 10,000 miles to a voyage. Oman’s ports at Duqm and Salalah, which were being discussed as bypass options, were struck by Iranian drones, with fuel storage facilities at Duqm damaged. The Joint War Committee of the London insurance market subsequently added Omani waters to its high-risk maritime area list, meaning even the bypass routes became expensive to insure.
The spot price to ship a standard 40-foot container rose 20 to 25 percent on the main routes from the Far East to Europe and the US West Coast. War surcharges on routes from the Far East to the Middle East Gulf and Red Sea spiked nearly 200 percent between late February and late March. This is not just an oil story. Every commodity moving through the region carries dramatically higher transport costs now, and that feeds directly into global inflation in ways the market is still underestimating.
Where the shipping trade lives
The tanker operators and owners with vessels already positioned outside the conflict zone are the cleaner plays here. The ones loading in West Africa, the US Gulf, Brazil, and Guyana are seeing demand surge as Asian buyers scramble to replace the Gulf barrels they can no longer access reliably. But the less obvious and more durable angle is the ton-miles argument.
When crude flows reroute around the Cape of Good Hope instead of through Hormuz and Suez, the same volume of oil requires significantly more ships to transport it because each vessel is tied up at sea for much longer. A voyage that used to take three weeks now takes six or seven. That structural increase in ton-miles needed effectively tightens the global tanker supply even without a single new barrel being added or removed from world markets. It is a mathematical squeeze on fleet availability that persists well beyond the conflict itself, because rerouting habits and buyer diversification strategies do not reverse overnight even after the strait reopens. Asian buyers who have spent months building alternative supply relationships with West African and Atlantic basin producers do not simply abandon those relationships the moment Hormuz clears. The trade shift has stickiness, and that stickiness supports day rates longer than most people are currently modeling.
I will discuss specific names in the subscribers chat as I trade them.
The insurance angle
The direct marine war risk insurance market is largely not accessible through American-listed equities in a clean way. The major underwriters are Lloyd’s syndicates and European-listed reinsurers, which limits the playbook for those of us focused on American-listed names.
The more interesting angle is actually the other side of the trade. The companies paying these premiums are getting squeezed hard. Refiners, commodity traders, and operators with heavy Gulf sourcing dependence are absorbing dramatically higher input costs on every cargo they move. For some of these companies the insurance and freight cost explosion is the difference between a profitable quarter and a very painful one. That creates a short side opportunity in the names most exposed to Gulf-dependent logistics, and it is worth watching carefully as earnings begin to reflect what has happened over the past five weeks. I will most likely avoid trading the insurance angle, but the framework is straightforward: follow the pain to find the short, and follow the rerouted demand to find the long.
What the Conflict Has Done to Helium and Aluminum
Beyond oil and natural gas, the conflict has caused specific, documented damage to industrial infrastructure that most financial media is barely covering. Two supply chains in particular deserve real attention: helium and aluminum. And in both cases, we are not talking about vague disruption risks, we are talking about named facilities that are offline right now, with recovery timelines that stretch well beyond any ceasefire.
Start with helium.
Qatar produces roughly one third of the world’s helium, and that production has been halted entirely following Iranian strikes on its gas infrastructure. The facility at the center of this is QatarEnergy’s Ras Laffan Industrial City, the largest liquefied natural gas plant in the world, which produces helium as a byproduct. On March 18, QatarEnergy confirmed that Iranian ballistic missiles struck Ras Laffan for the second time that month, causing extensive damage to the Pearl GTL facility. In the early hours of March 19, several additional LNG facilities were targeted, causing sizeable fires and further damage.
The recovery timeline is years. QatarEnergy told Reuters that the attacks wiped out 17 percent of the country’s LNG export capacity, and that repairs could take three to five years. That is not a typo. Three to five years. The market is already feeling it. Spot helium prices have surged between 70 and 100 percent in some cases within little more than a week. Hundreds of specialized cryogenic containers are now stuck in the Middle East, and direct helium buyers who typically lock in supply through long-term contracts are now scrambling to secure short-term spot market cargoes.
South Korea and Taiwan, the world’s two largest semiconductor makers, are particularly exposed. South Korean manufacturers sourced 55 percent of their helium from Gulf Cooperation Council countries in 2025, and Taiwan sourced 69 percent from the GCC in 2024. Why does this matter beyond the obvious? Because helium is not substitutable. It is used in computer chip production to displace oxygen and moisture within fabrication facilities, as a coolant during high-temperature stages of chip production including the etching process, and in the production of silicon wafers. There is no workaround. You either have helium or you do not make chips at the same rate. This is a direct knock-on effect for the AI buildout that many are ignoring.
Now the aluminum story, which broke even more recently.
Iran struck leading aluminum smelters in the UAE and Bahrain, damaging facilities at Emirates Global Aluminium and Aluminium Bahrain and injuring workers. The UAE facility is the one worth understanding in detail. Emirates Global Aluminium’s Al Taweelah site, one of the world’s largest aluminum production complexes, sustained significant damage from Iranian missile and drone attacks, forcing the facility to halt operations entirely. The complex, including the smelter and casthouse, power plant, Al Taweelah alumina refinery, and recycling plant, was fully evacuated and placed in emergency shutdown.
The damage is worse than a typical shutdown. The smelter lost power due to the strikes and the smelting facilities known as potlines were forced into an uncontrolled shutdown. When you lose power during active smelting, the molten metal inside the circuits solidifies. You are not looking at a restart. You are looking at a rebuild. Early assessments indicate that a full recovery of primary aluminum production could take up to 12 months. The Al Taweelah smelter produced about 1.6 million tonnes of cast metal in 2025. That production is now gone for the better part of a year at minimum.
In Bahrain, Aluminium Bahrain initiated a controlled shutdown of about 19 percent of its production capacity due to disruption in the Strait of Hormuz, even before the direct strikes on its own facility.
The IEA’s executive director stated that at least 40 energy assets across nine countries in the Middle East have been severely or very severely damaged since the war began, and that damage to oil and gas fields, refineries, and pipelines would take considerable time to repair. Forty assets across nine countries. That is the actual scale of what is happening, and the aluminum and helium stories are just two threads in a much larger industrial unraveling.
For producers and processors outside this blast radius, particularly those with domestic supply chains and no Middle East exposure, these are among the most compelling swing trades in this environment. The disruption timeline is long enough to give these positions room to run, but nothing here is a forever hold. We will take profits, rotate, and adjust as the situation develops. That is the whole point of staying nimble when the world is this uncertain. There are some excellent names for both Aluminum and Helium trades both obvious big ones and some under the radar multi baggers.
Why Software, Not AI, Is the Tech Trade in the Next Rally
Let me be precise here, because the distinction matters more than it might seem at first glance.
Tech is a broad umbrella that covers everything from semiconductor equipment to cloud infrastructure to AI chips to enterprise software. When I say software could lead the next recovery, I am talking specifically about the software layer, the companies that sell subscriptions, licenses, and services, many of which got absolutely destroyed in this selloff despite having nothing to do with Middle East supply chains or tariff exposure. These are businesses with recurring revenue, relatively predictable earnings, and no physical inventory risk. They sold off because of the fear of ai replacing them, and that creates the kind of dislocation that swing traders exist to capture. Yes some will go bankrupt as AI replaces them but those who are not getting replaced that also went down with the entire SAAS crash will go up vertically.
AI hardware and AI platform names are a different story, and there are now multiple layers of pressure stacking against them simultaneously.
Start with the supply chain problem that almost nobody in financial media is connecting to AI valuations, including one of the large account is in the top list of the finance substack.
As I laid out in the helium and aluminum section, QatarEnergy’s Ras Laffan facility, which was responsible for roughly a third of the world’s helium supply, is offline for what could be three to five years. South Korean manufacturers sourced 55 percent of their helium from Gulf countries in 2025. Taiwan sourced 69 percent from the same region. These are not minor suppliers to the chip industry. SK Hynix, Samsung, and TSMC are among the largest consumers of helium in the world, and they source heavily from exactly the facilities that are now damaged or inaccessible. Helium is used at multiple stages of chip production, from wafer fabrication to the etching process to cooling during lithography. There is no substitute and there is no quick fix. When the input costs for making chips go up sharply and supply becomes uncertain, the economics of the AI buildout change whether the market has priced that in yet or not.
The aluminum damage adds another layer. The components that go into data center infrastructure, server racks, cooling systems, power distribution units, and the physical hardware that houses AI compute, all of these have aluminum in them. Emirates Global Aluminium’s Al Taweelah site, which produced 1.6 million tonnes of cast metal annually, is now offline for up to 12 months. Bahrain’s Alba has already shut down nearly a fifth of its capacity. Gulf producers account for roughly 8 percent of global primary aluminum output, and most of it moved through the Strait of Hormuz, which is effectively closed. This does not stop the AI buildout, but it makes it slower and more expensive at exactly the moment when the market is already questioning whether AI capital expenditure can be justified at current levels.
Then there is the capital flow problem, which compounds everything above.
A significant portion of the money that has been flowing into American AI infrastructure over the past 18 months has come from Gulf Cooperation Council sovereign wealth funds and private investors. Saudi Arabia, the UAE, and Qatar have been aggressive buyers of AI-related equities and have made substantial commitments to AI infrastructure projects in the United States. With the Middle East now a war zone and those governments managing serious domestic economic pressure, that capital flow does not simply pause. If the war escalate, GCC countries can get wrecked for a long time with the destruction of their desalination plants. Funds that need liquidity pull from wherever they have gains, and American AI stocks sitting on multi-year runs are near the top of that list. The same region that was propping up AI valuations is now a source of forced selling.
Put all three of these together. Input costs for chip manufacturing are rising because helium is scarce and expensive. Data center buildout costs are rising because aluminum is disrupted. And the sovereign capital that was underwriting AI equity valuations is being pulled back to deal with a war at home. These are not separate stories. They are the same story told from three different angles, and they all point in the same direction for AI multiples in the near term.
Software does not carry any of this baggage. A boring enterprise software company trading at a reasonable multiple after a 35 to 40 percent drawdown has none of these supply chain dependencies, none of this sovereign capital exposure, and none of the input cost inflation risk. The servers it runs on were already built. Its margins do not move because helium prices doubled.
The sequencing I expect, if the recovery comes, is this: software leads first because it is the most oversold relative to fundamentals and carries the cleanest risk profile. Semiconductors and hardware infrastructure follow as confidence builds and supply chains begin to stabilize. AI names catch a bid last, in the speculative tail of the rally, when risk appetite is fully restored and people stop caring about multiples again. Knowing the sequence determines where you want to be and when. But the AI names will catch in an explosive way as the supply chains ease in the final phase before bubble top if the scenario to 8700spx plays out. So when this correction bottoms and rallies, software may out perform ai initially, then AI catches up in a melt up fashion. The retail will likely buy the dip on the AI too early and rotate to software too late and miss the AI’s catch up run.
How the Next All-Time High Actually Gets Built
If we get the recovery, and I still think we do, the fuel for it is probably not what most people are picturing. The mechanism that could drive this market to new highs is something far more blunt: war economy spending.
Trump has already floated a $1.5 trillion spending framework, and the language coming out of Washington has shifted unmistakably toward a wartime posture. When the United States government decides to spend and claim they want war economy, the money goes into defense contracts, weapons manufacturing, shipbuilding, ammunition production, advanced electronics, satellite systems, and the entire industrial supply chain that feeds those industries.
This is not speculative because this is how war economies work. The government becomes the customer of last resort, and it is not a price-sensitive customer as margins expand. Stocks that were ignored during the AI bubble suddenly look like the most reliable earnings stories in the market.
The setup for defense and weapons names right now looks similar to what we described for fertilizer and oil and gas. There are prime contractors everyone already knows, and then there are the second and third tier suppliers, the less-covered names that do the actual manufacturing, that tend to move faster and further when the cycle turns. Zero Middle East production exposure, domestic revenue base, and a government that has just decided to spend aggressively on their products. That is the profile we are looking for. Specific names and entries will be discussed in the subscribers chat whenever I trade. Some names have already been discussed.
The broader point is this: the path to all-time highs, if it comes, is probably not led by AI enthusiasm. It is more likely built on a combination of oversold software, defense spending tailwinds, and energy names that are benefiting from the same conflict that caused the correction in the first place. That is a very different portfolio than what most people are holding right now.
Don’t become exit liquidity following big accounts
There is something happening in financial media that does not get talked about honestly, so I am going to say it plainly.
Some of the largest and most-followed accounts in this space operate with a model that is genuinely harmful to the retail traders who follow them. The model works like this: maintain a portfolio of hundreds of names across every sector and theme imaginable, surface the winners publicly with screenshots and threads, let the losers quietly disappear into the noise, and keep the record-keeping vague enough that no honest performance audit is ever possible.
In a bull market, this approach looks like genius. Everything goes up, they highlight the things that went up the most, and their follower count grows. What they are actually doing is creating exit liquidity for institutional positions. By the time a thesis goes viral, by the time it is being discussed on mainstream financial media and retail traders are reading about it in newsletters and clicking subscribe, the smart money that originated the idea is already looking for the door. The viral moment is not the signal to enter. It is often the signal that someone needs you to enter so they can exit.
Think carefully about why a large account would publish a piece without a paywall, let it get picked up by mainstream media, and seed a particular narrative about market timing. Content that is given away for free at scale is almost always doing a job. Sometimes that job is to condition a large audience to expect a particular outcome at a particular time, which conveniently aligns with someone else’s liquidity needs. Retail traders who anchor their timing to that narrative end up holding the bag while the accounts they trusted quietly repositioned weeks earlier.
Why Swing Trading Beats Buy and Hold From Here
The buy and hold religion was built for a specific era, and that era may be ending soon when the everything bubble tops before 2030.
Buy and hold works when you have a multi-decade tailwind of globalization, falling interest rates, expanding multiples, and a central bank willing to backstop any serious decline. Strip any one of those away and the math gets harder. Strip several of them away at once, which is what appears to be happening, and buy and hold, especially 100ds of names stops being a strategy and starts being a hope.
We are potentially looking at a period of sustained multiple compression, geopolitical disruption to global supply chains, a reversal of the capital flows that inflated asset prices over the past decade, and a domestic policy environment that is deliberately restructuring the global trading order. In that environment, the idea that you buy a diversified basket of large-cap American equities and check back in five years is wishful thinking than an investment philosophy.
Swing trading in this environment is not about being smarter than the market. It is about being honest about what the market is doing and positioning accordingly. Right now, certain things are going to go down regardless of what the Fed does or what the headline CPI prints. And certain things are going to go up regardless of whether the broader market recovers or continues to slide. Those disconnects are where the money is.
We will be wrong sometimes. Every trader is. But when you are working with a defined set of names, clear entry and exit criteria, and a documented record of every transaction, you can learn from the mistakes and compound the wins. You cannot do that when you own 500 names and only talk about the ones that worked.
How We Are Positioned
Both portfolios are actively deployed for what is happening right now and with only select names. We never hold more than 25 tickers in either of the portfolio and this allows us to stay only in quality trades. The options-only founding tier portfolio has been the more aggressive vehicle and is up over 100 percent since inception in July 2025. This founding tier subscription also includes the portfolio from the regular tier. The regular tier Best 25 holdings portfolio, which mixes stocks and options is available to all regular subscribers, is positioned with the same macro thesis but with more flexibility on holding period and risk per name.
What we are trying to do is be in the right names on both the short and long side as the setup plays out, with a swing trading approach and time horizons ranging from days to roughly a year.
Every trade is shared live in the chat with size and entry price, before or immediately after execution in the subscribers only chat. There is transaction log of every trade since inception.
The window for the easy money in passive investing may already be closing. The traders who recognize that early and adapt will do well.

Great write up and assessment of macro forces and what recovery could look like. Thank you for taking the time to write this.
I show as subscribed but when I go to the thread it says only subscribers can reply. I’m not seeing any trades so far this week, is that correct?